
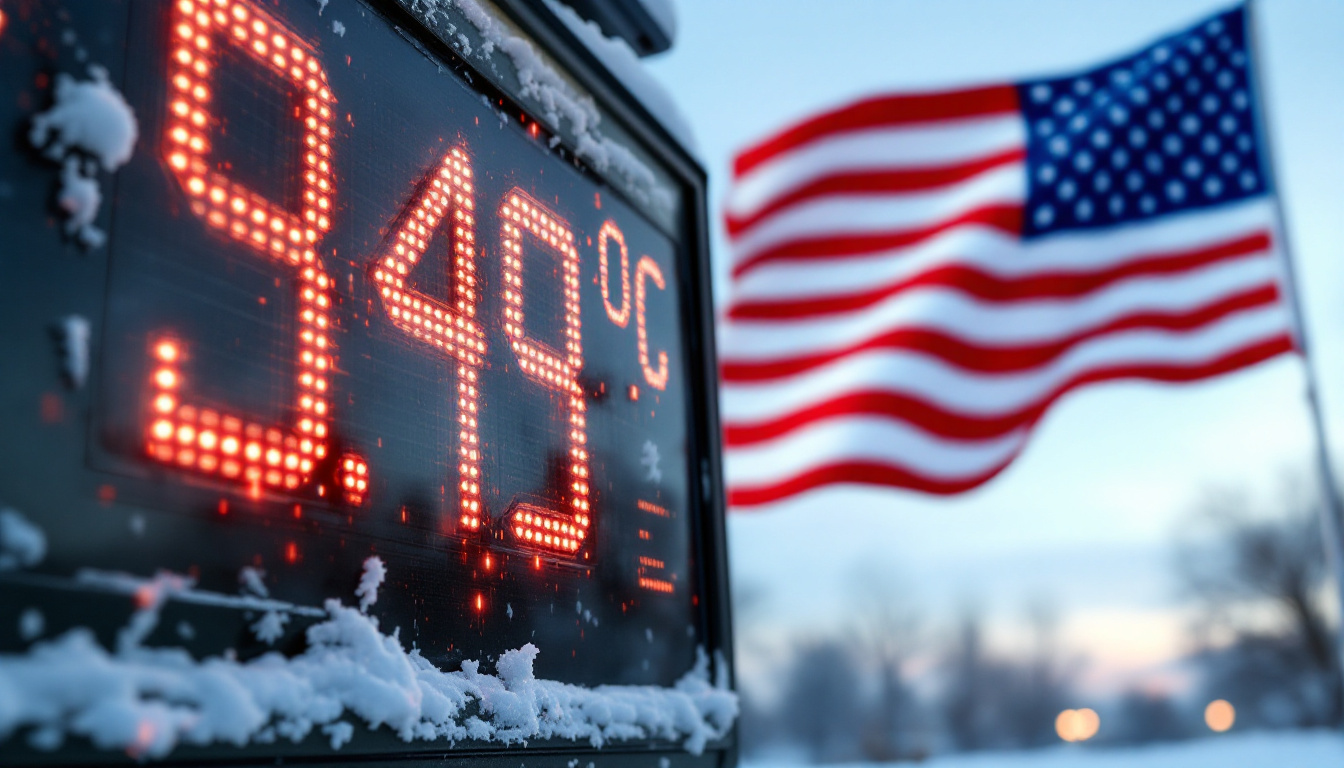
On September 25, the national average for a gallon of gas sat at $4.49. By October 25, it had barely budged — $4.25. Then the midterm election happened on November 5, and by November 16, the price had cratered to $3.81.
Fifty-seven cents in a month. The fastest collapse in eighteen years — and not a single penny of it arrived before your ballot hit the box.
President Trump noticed. He posted on Truth Social what a lot of Americans were already thinking: "Biggest drop in gasoline in 18 years. Notice that they waited until after the 'Election?'" The quotation marks around "Election" doing the work of an entire editorial page.
The numbers, tracked by GasBuddy.com and reported by The Gateway Pundit, tell a story that doesn't require much imagination to interpret. Gas held stubbornly above $4.25 through the final weeks of campaign season — the stretch when every incumbent needed voters feeling optimistic about the economy. On November 9, four days after ballots were cast, the average crossed below $4.00. A week later it was $3.81 and still falling.
Trading analyst Shoenlaw, writing for tradersunion.com, confirmed the timeline: "Last week saw the biggest drop in retail gas prices at the pump in 18 years!" The exclamation point seems appropriate. Eighteen years covers three presidencies, two recessions, a pandemic, and a global supply chain meltdown — and none of those events produced a drop this steep or this sudden.
What makes the timing especially notable is that Trump called it in advance. On September 9, with gas still near its pre-election peak, he told supporters: "Right after the election, gas prices are gonna be tumbling down." At the time, the usual credentialed analysts treated the prediction the way they treat most Trump predictions — as bluster worth ignoring. The GasBuddy chart now reads like a receipt.
Gas prices are set by global crude markets, refinery margins, and seasonal demand shifts — none of which consult the electoral calendar. That's the standard explanation, and it's technically accurate in the same way that saying a house fire was caused by "rapid oxidation" is technically accurate. It tells you the mechanism without telling you anything useful about why the match got struck when it did.
The pattern is worth naming plainly. Prices that could have fallen in October didn't. Prices that could have provided relief during early voting didn't. The relief arrived the week after the last ballot was counted, at a pace not seen since 2008. Whether that's manipulation, convenient market timing, or the economic equivalent of a magician's misdirection, the result is identical: American consumers paid peak prices during peak political season and got the discount after it no longer mattered.
For retirees on fixed incomes, the difference between $4.49 and $3.81 at the pump isn't a rounding error. It's the grocery run that gets a little less painful, the thermostat that gets turned up one degree, the prescription that doesn't get split in half this month. Those weeks of inflated prices cost real money from real people who don't have the luxury of waiting for post-election corrections.
Trump's September prediction landed at $3.81 on November 16. The chart doesn't require commentary.